CASE 04 · GRID INTELLIGENCE · 2026
KESİT
/ EŞİK
I turned generation, demand, storage and transmission capacity into one legible decision experience built on a shared physical network.
02 — THE PROBLEM
Plenty of energy data.
No shared decision picture.
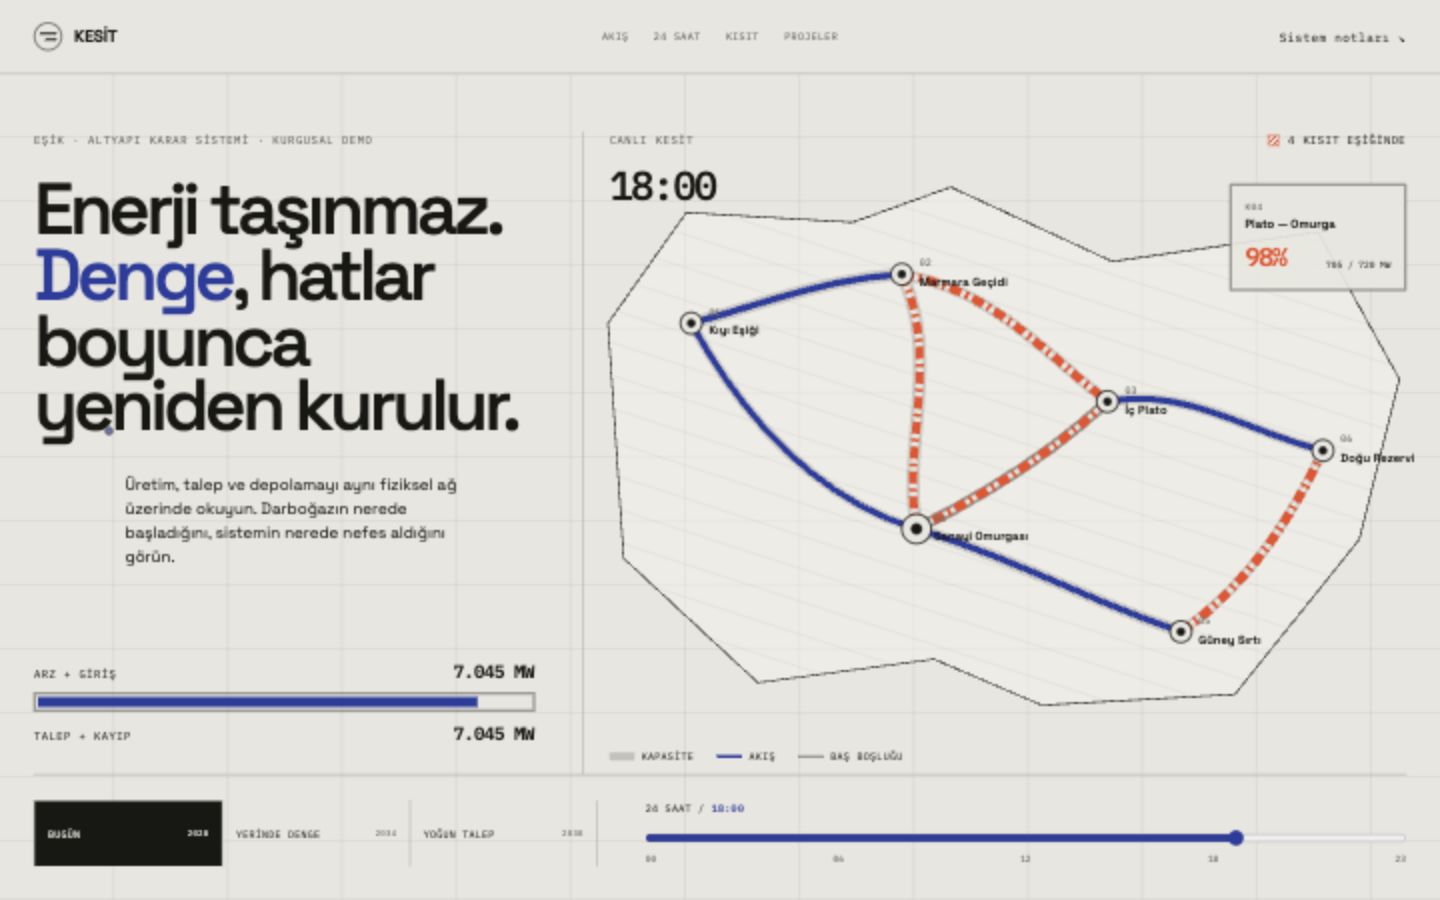
Generation, demand, storage and transmission are often shown in separate charts. In reality, one corridor reaching its limit emerges elsewhere as curtailment, storage demand or a rerouting need.
The goal was a shared visual language that preserves technical detail while making system behaviour readable within seconds.
03 — APPROACH
The map is not decoration.
It is the model.
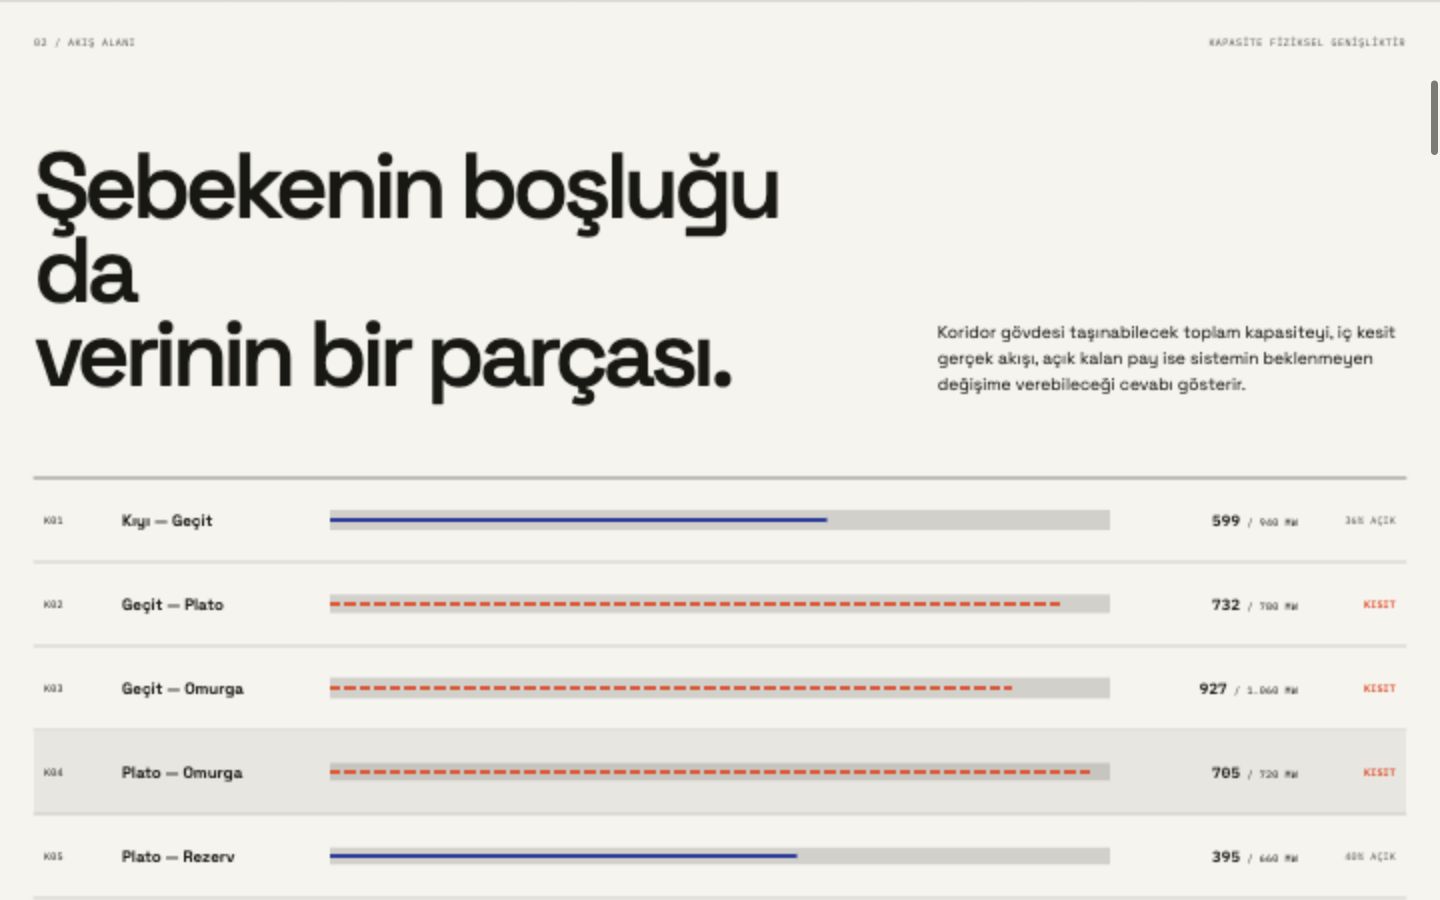
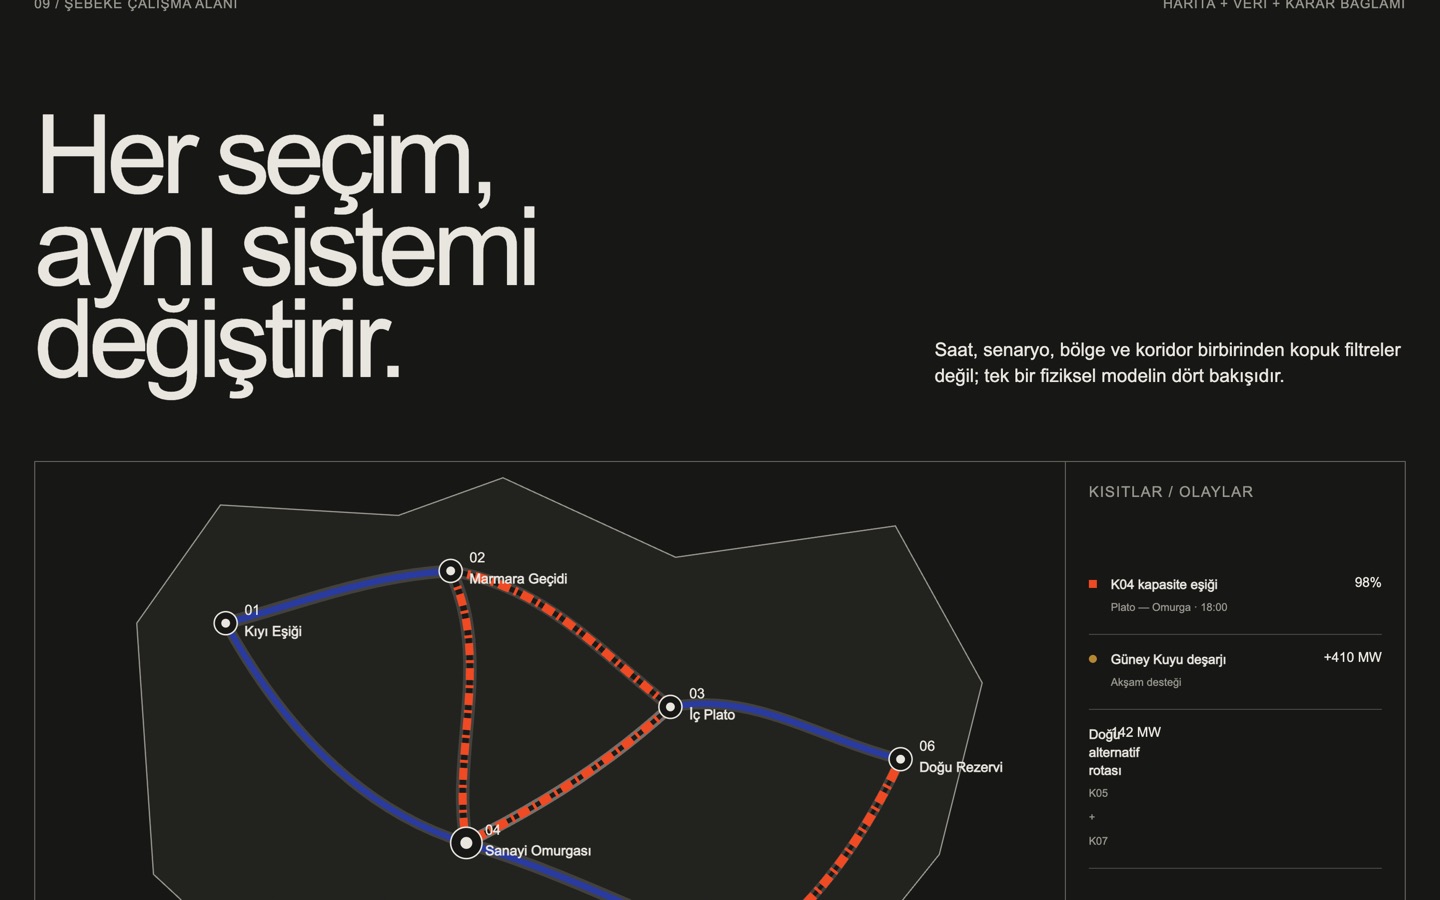
Corridor width shows physical capacity, the filled section shows actual flow, and open space shows manoeuvring room.
Hour, scenario, region and corridor are four views into the same system state—not disconnected filters.
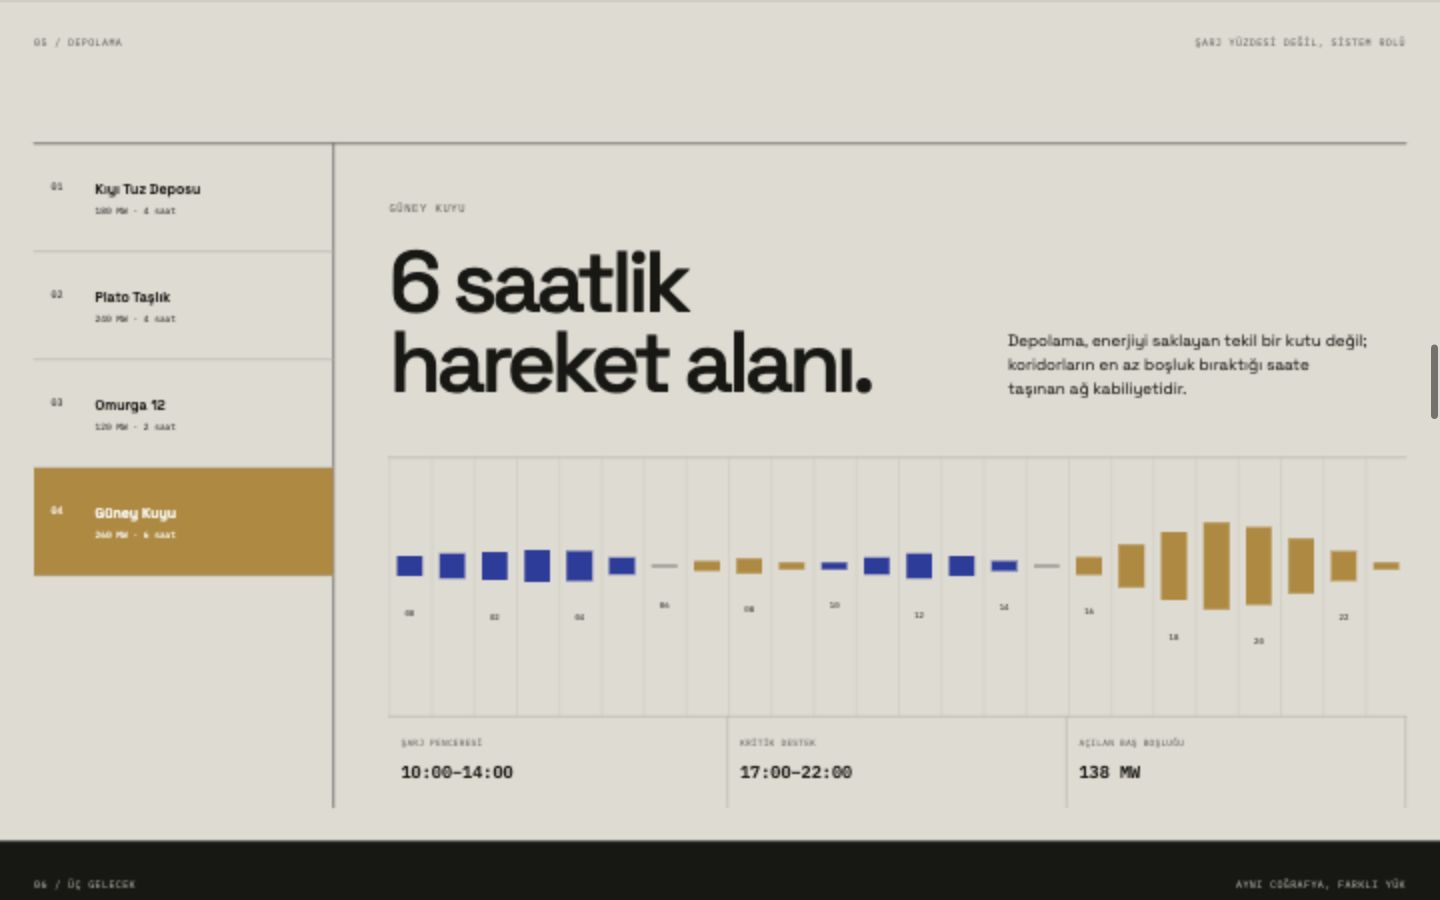
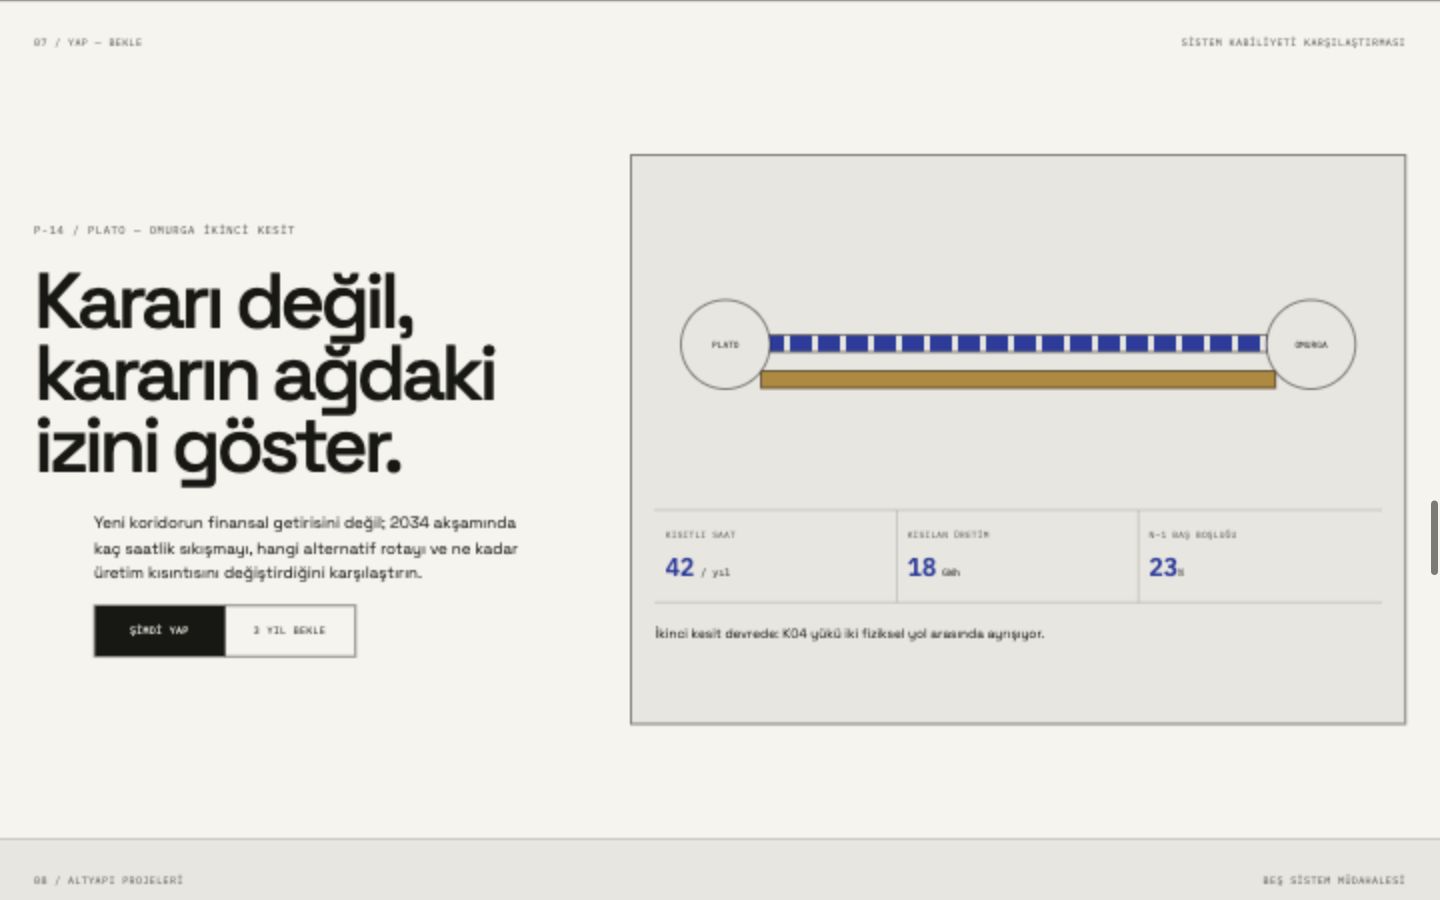
Constraint, storage response and alternate route read as one causal chain.
Desktop and mobile layouts were validated for keyboard, touch and reduced-motion preferences.
04 — FLOW FIELD
The grid's empty space
is data too.
Eight corridors change form and colour as they approach capacity. Headroom makes the network's physical response to unexpected change visible.
05 — SYSTEM BEHAVIOUR
Not one number.
Physics changing through time.
06 — PRODUCTION PROOF
A complex model.
A lean delivery.
| Model | 24 hours · 6 regions · 8 corridors · 4 storage assets |
| Scenarios | 2028 today · 2034 local balance · 2038 intense demand |
| Interaction | Hour, scenario, corridor, constraint and investment decision |
| Visualisation | SVG grid map · demand curves · flow cross-sections |
| Accessibility | Semantic structure · visible focus · keyboard and touch |
| Responsive | Distinct compositions for mobile, tablet and wide screens |
| Quality | Lint · type checking · automated tests · live-browser QA |
| Delivery | Vercel · live production |
07 — OUTCOME
Data, map and decision
in one live experience.
KESİT / EŞİK shows that I can design a complex infrastructure system both technically and editorially, then turn it into an interactive production-ready product.